
State of Animation 2026: What Analyzing 2M Animated Videos Reveals?
AI has emerged as a major boon to the animation industry.
It has helped newbies who once found animation challenging to unleash their creativity while also helping agencies improve their workflow efficiency and thereby reducing turnaround time for large-scale animation projects.
We found an astronomical 301% increase in AI usage from last year in short-form content alone.
But as AI takes center stage, does that mean no one is creating projects from scratch or using template-based creations anymore?
That is why we decided to take a closer look at the state of animation in 2026.
We analyzed 2 million animation videos created between June 2025 and June 2026 to understand and identify patterns in the creation journey.
By the end of this state of animation report, you will have an understanding of -
- Adoption of AI-assisted creation vs traditional and template-based workflows
- Identifying which creation methods are gaining popularity
- Preferred project duration time
- Country-wise analysis to highlight top-performing regions, emerging markets
- Industry-wise breakdown to find which sectors are driving the most adoption across our platform
Methodology
This State of Animation report is based on anonymized data from our 35M users, collected between Jun 2025 and Jun 2026.
We primarily assessed 6 different datasets:
- AI Projects Creation and Adoption
- Manual Animation Creation Performance
- Animation templates usage patterns
- Country-wise usage data and regional preferences
- Industry-wise usage data and preferences
- Duration metrics
These metrics are analyzed across all data segments to identify trends, patterns, and user behavior.
Let’s begin with the AI-assisted animation creation data.
AI Creation Insights
The data shows explainer content is the most sought-after category in AI-assisted creation, accounting for 44.93% of all projects, followed by training categories at 38.79% and educational at 8.20%.
The smallest slices are storytelling at 6.04% and personal/celebratory content at 2.04%.
In terms of numbers, 351,819 projects have been created in the General Explainer category, while 350,540 projects have been created in the Product Explainer category.
A General Explainer is an all-purpose, uncategorized explainer animation that can be used to explain a concept or an idea without being tied to a specific use case.
These AI adoption numbers show the need to deliver high-volume, informative content efficiently.
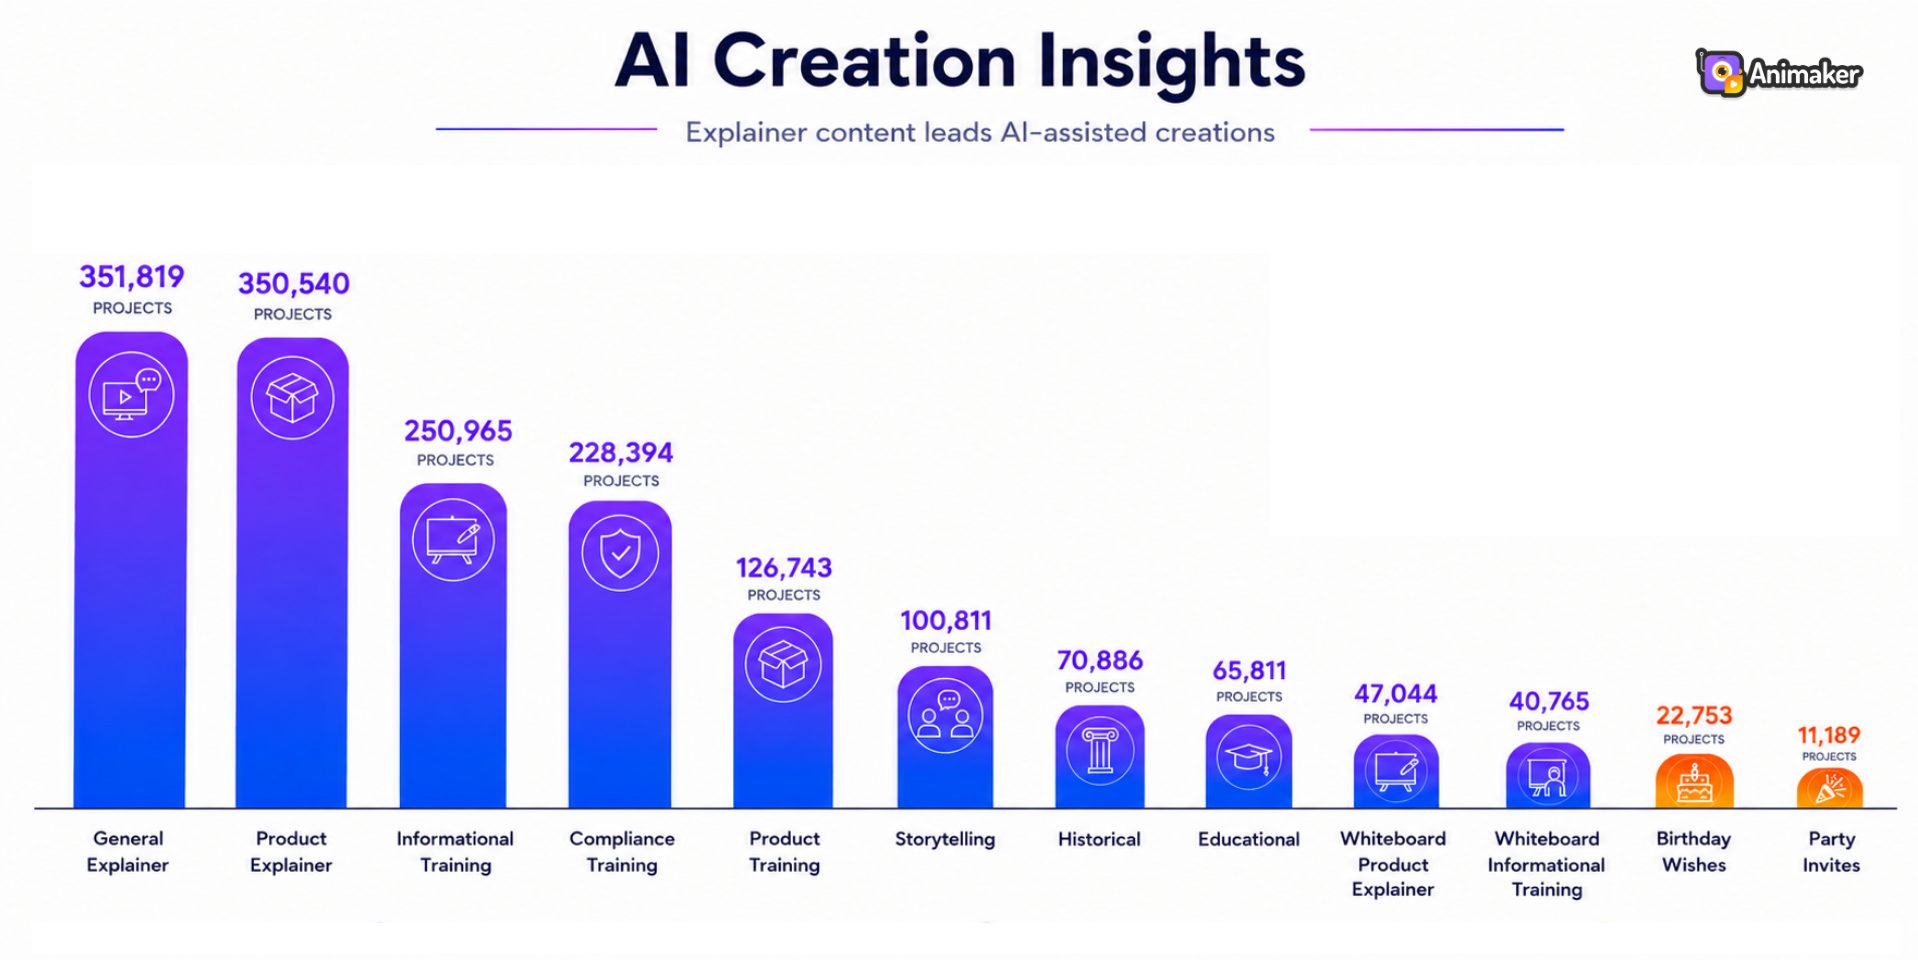
Then come the training-related categories like Informational Training (250,965), Compliance Training (228,394), and Product Training (126,743), indicating corporates adopting AI to create content.
The mid-tier category is Storytelling, with 100,811 projects created. This number aligns with the recent increase in storytime content on platforms like YouTube.
Appearances of Historical (70,886) and Educational (65,811) categories further reinforce the leverage of AI to create educational and explanatory content.
Whiteboard variants of training and explainer content (whiteboard product explainer - 47,044 and whiteboard informational training - 40,765) show that format diversity matters within the explainer segment.
We also noticed a 25% overall jump in training content creation from the previous year, reflecting the growing role of animation in the corporate space.
AI-assisted creations didn’t stop there. Users have used it for creating personal and celebratory content. Though minimal by comparison, categories like Birthday wishes (22,753) and party invites (11,189) represent a small fraction of total AI creation.
This highlights that AI adoption is primarily business- and education-driven rather than personal-driven.
Beyond longer-form videos, AI-assisted short-form content creation (AI clips) has seen a massive 301% jump from 10,074 projects created in 2025 to 40,361 projects created in 2026.
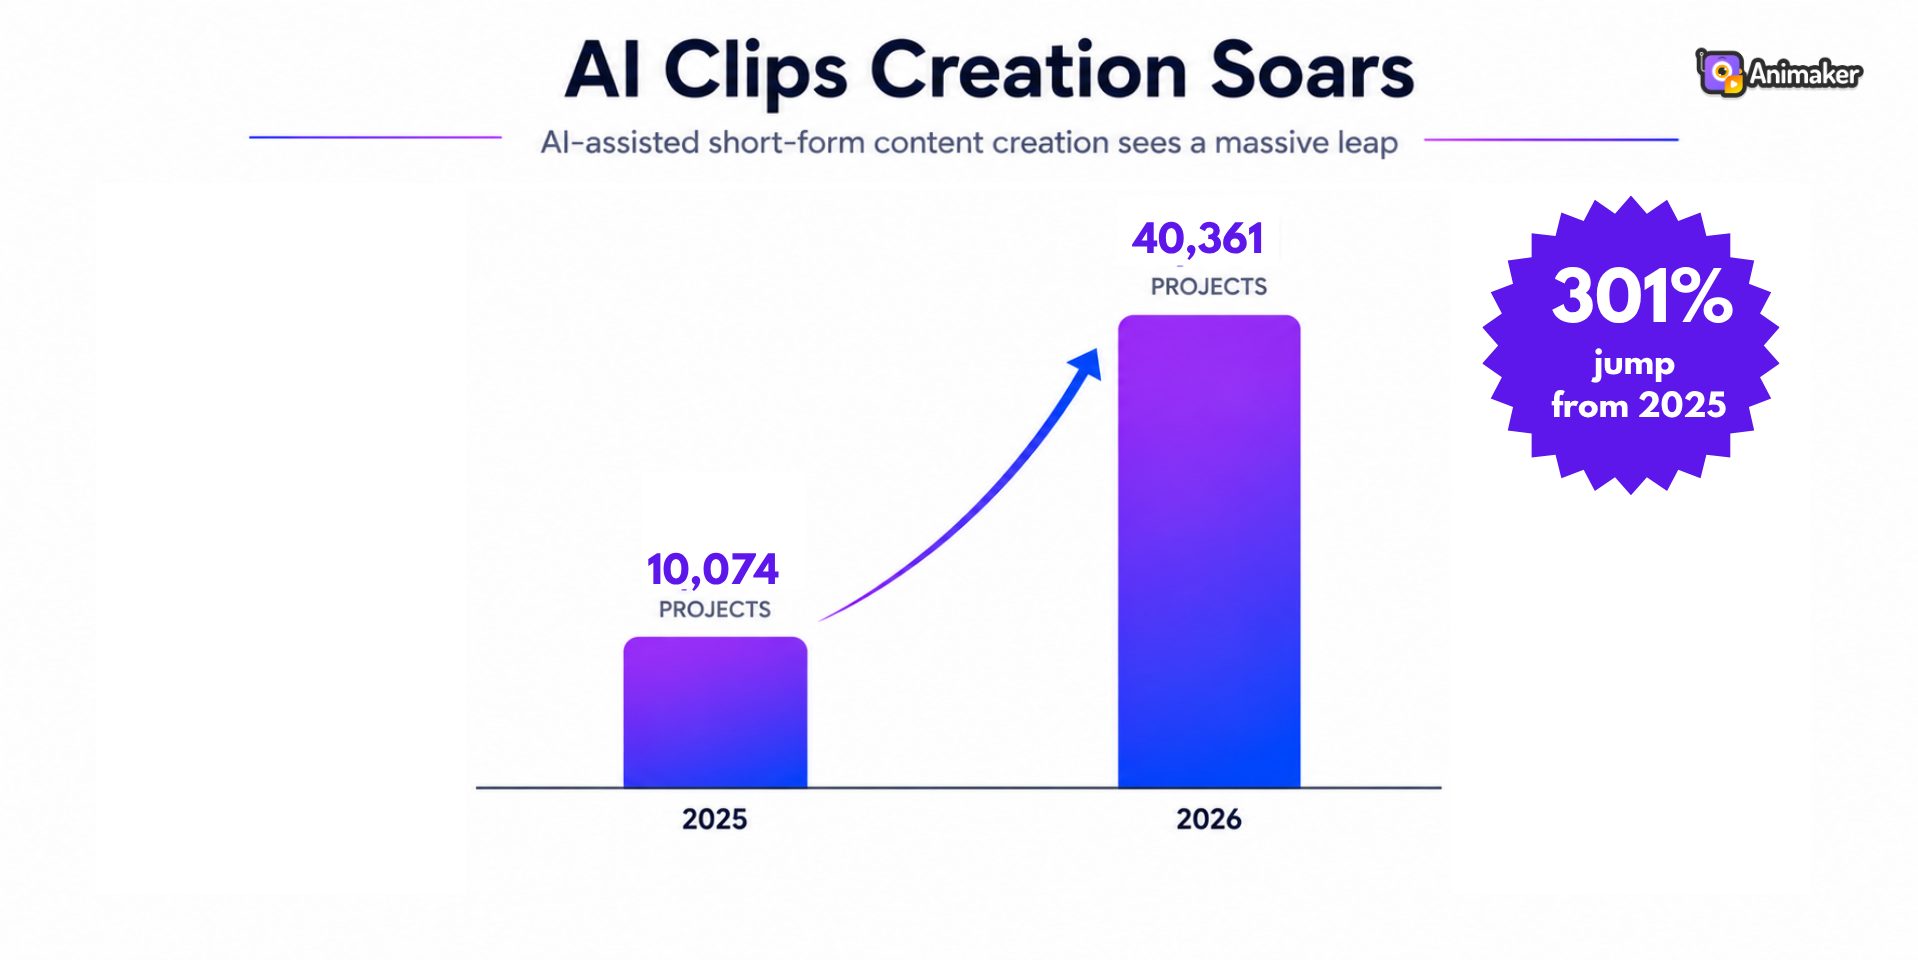
This rise in creation indicates a shift away from long-form dependency for quick viral reach.
Now, let’s see how manual animation creation has changed with the growth of AI.
Manual Animation Creation Performance
Manual Animation creation using blank projects has experienced a significant decline.
Data from the previous year (May 2024 - May 2025) shows a sharp drop from 6,293,127 to 2,261,999 in June 2025 - June 2026.
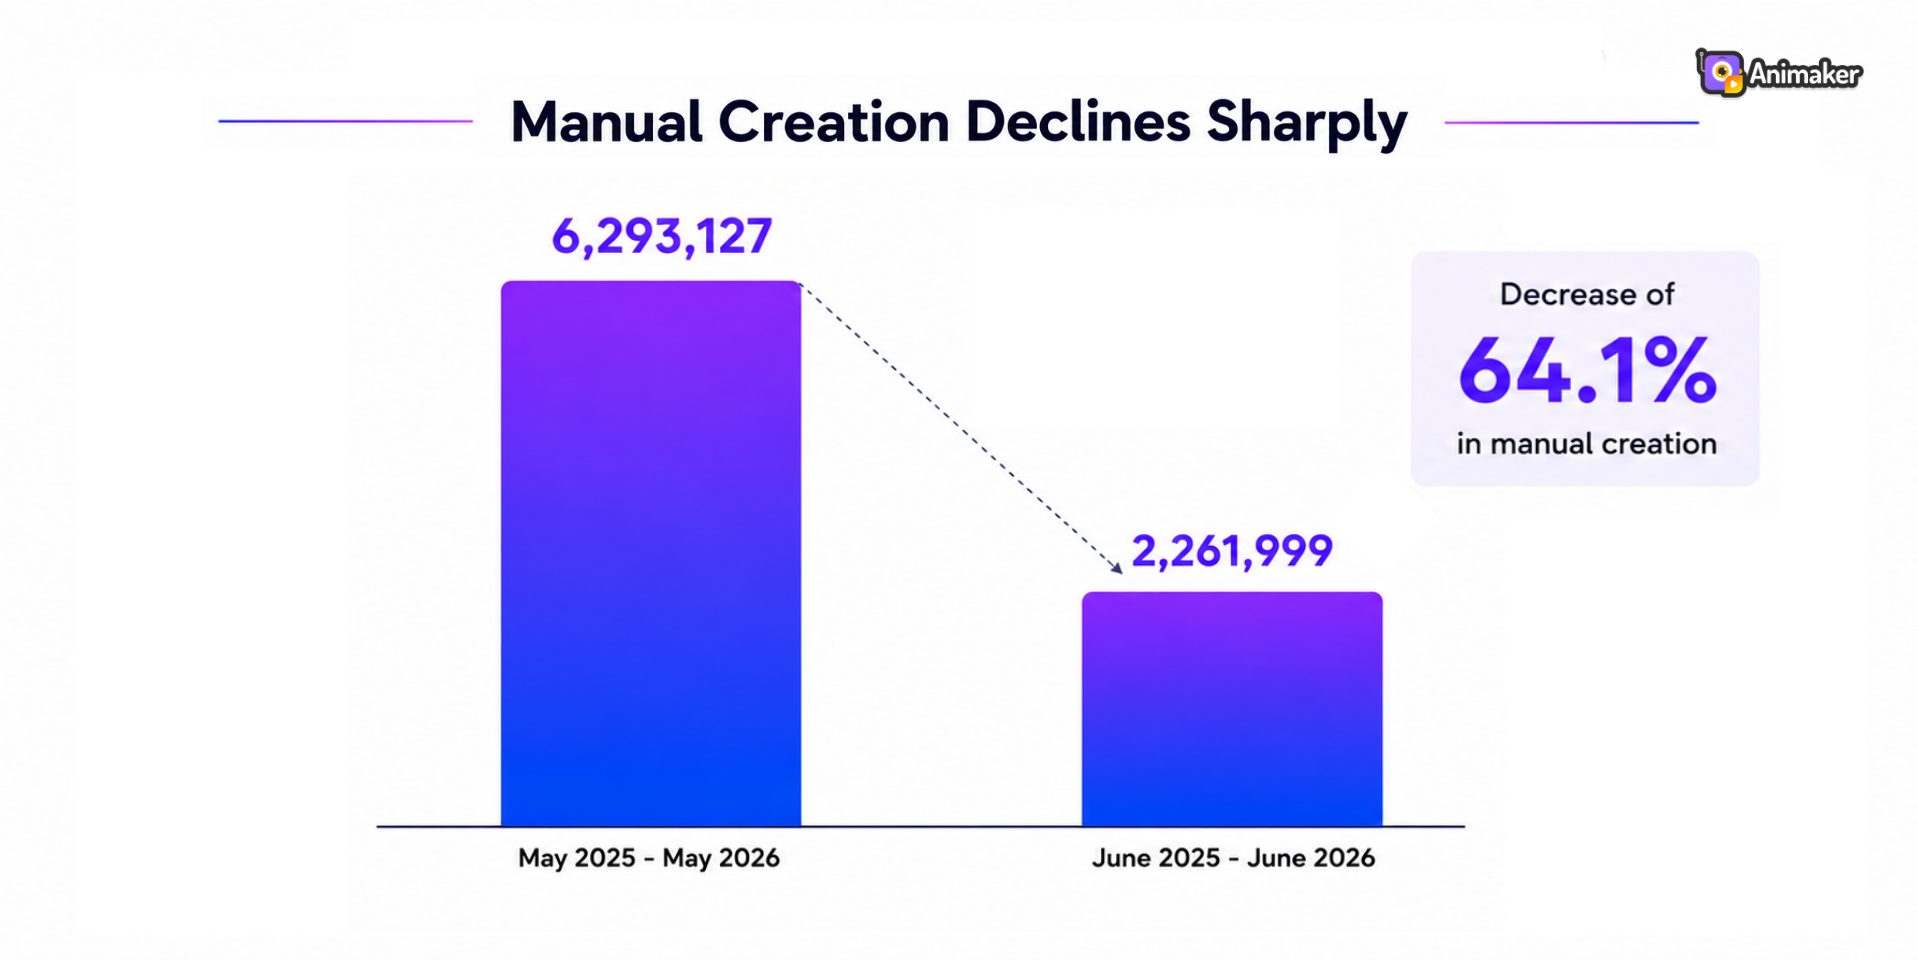
This 64.1% decrease in manual creation indicates a clear market shift from scratch-based animation creation, reflecting a change in user behavior and priorities.
One potential reason could be that experienced animators are opting for AI-assisted workflows, while new users are bypassing manual creation entirely to create polished animations with AI.
This is another key finding from our State of Animation report. Next, let’s see how users approach animation templates.
Animation Template Analysis
When it comes to creating through animation templates, the data shows major adoption of professional templates over other types.
In terms of percentage split-up, business templates account for 88.4% of all template creations, compared with 11.6% for personal and celebratory templates.
Business-oriented templates dominate usage, with the template Promote Your Product or Service leading at 46,377 creations, followed by Teacher Video Resume with 38,865 creations and What Are Stock Options? coming in third at 29,786 creations.
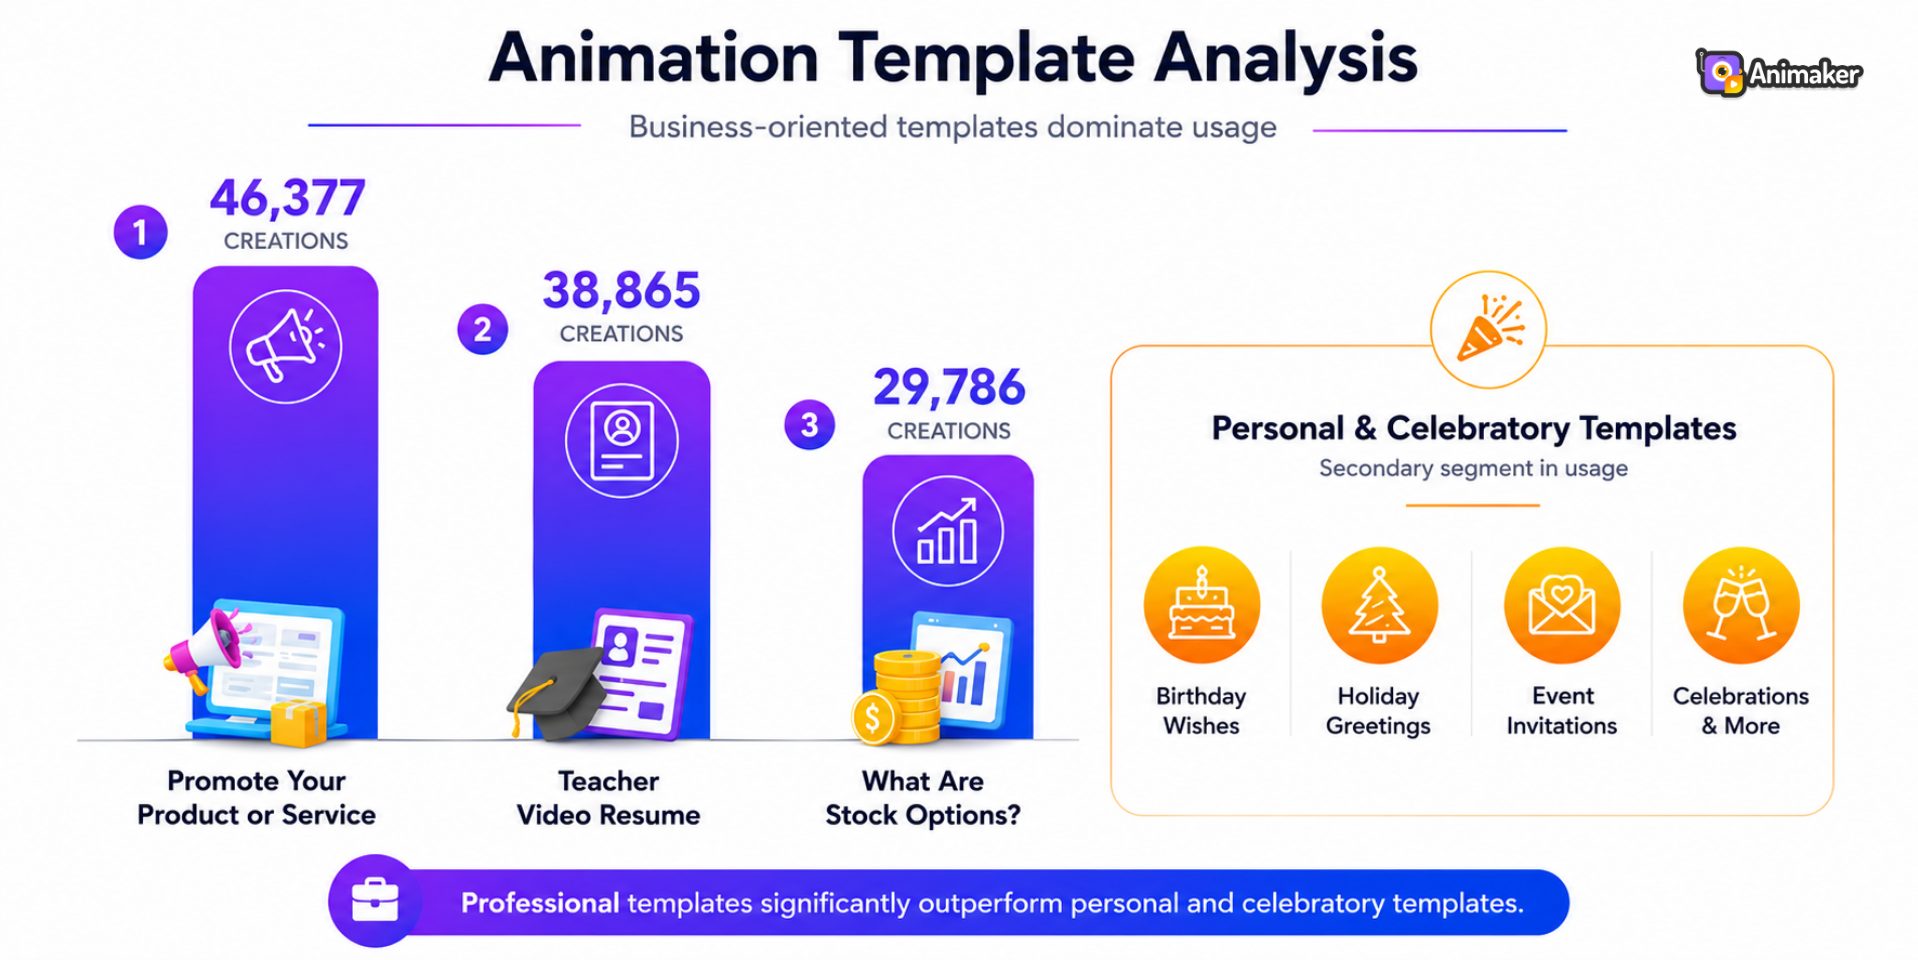
Promotional templates for services (real estate, insurance, tax advisory, marketing) and corporate training materials (workplace safety, compliance policies, HR training) show
consistent high usage, indicating strong demand for business-related animations.
Personal and celebratory templates (birthday wishes, holiday greetings, event invitations) form a secondary tier but have much lower adoption numbers than professional templates, with a couple thousand projects each.
Professional templates consistently outperform niche personal-use templates, suggesting that templates that meet immediate business communication needs drive most platform activity.
But how do these creations play out across the globe?
Geographic Analysis
Animated Explainers
India leads the animated explainers with 227,034 projects, which is more than 3.6x that of Brazil, in second place, with 62,060 projects.
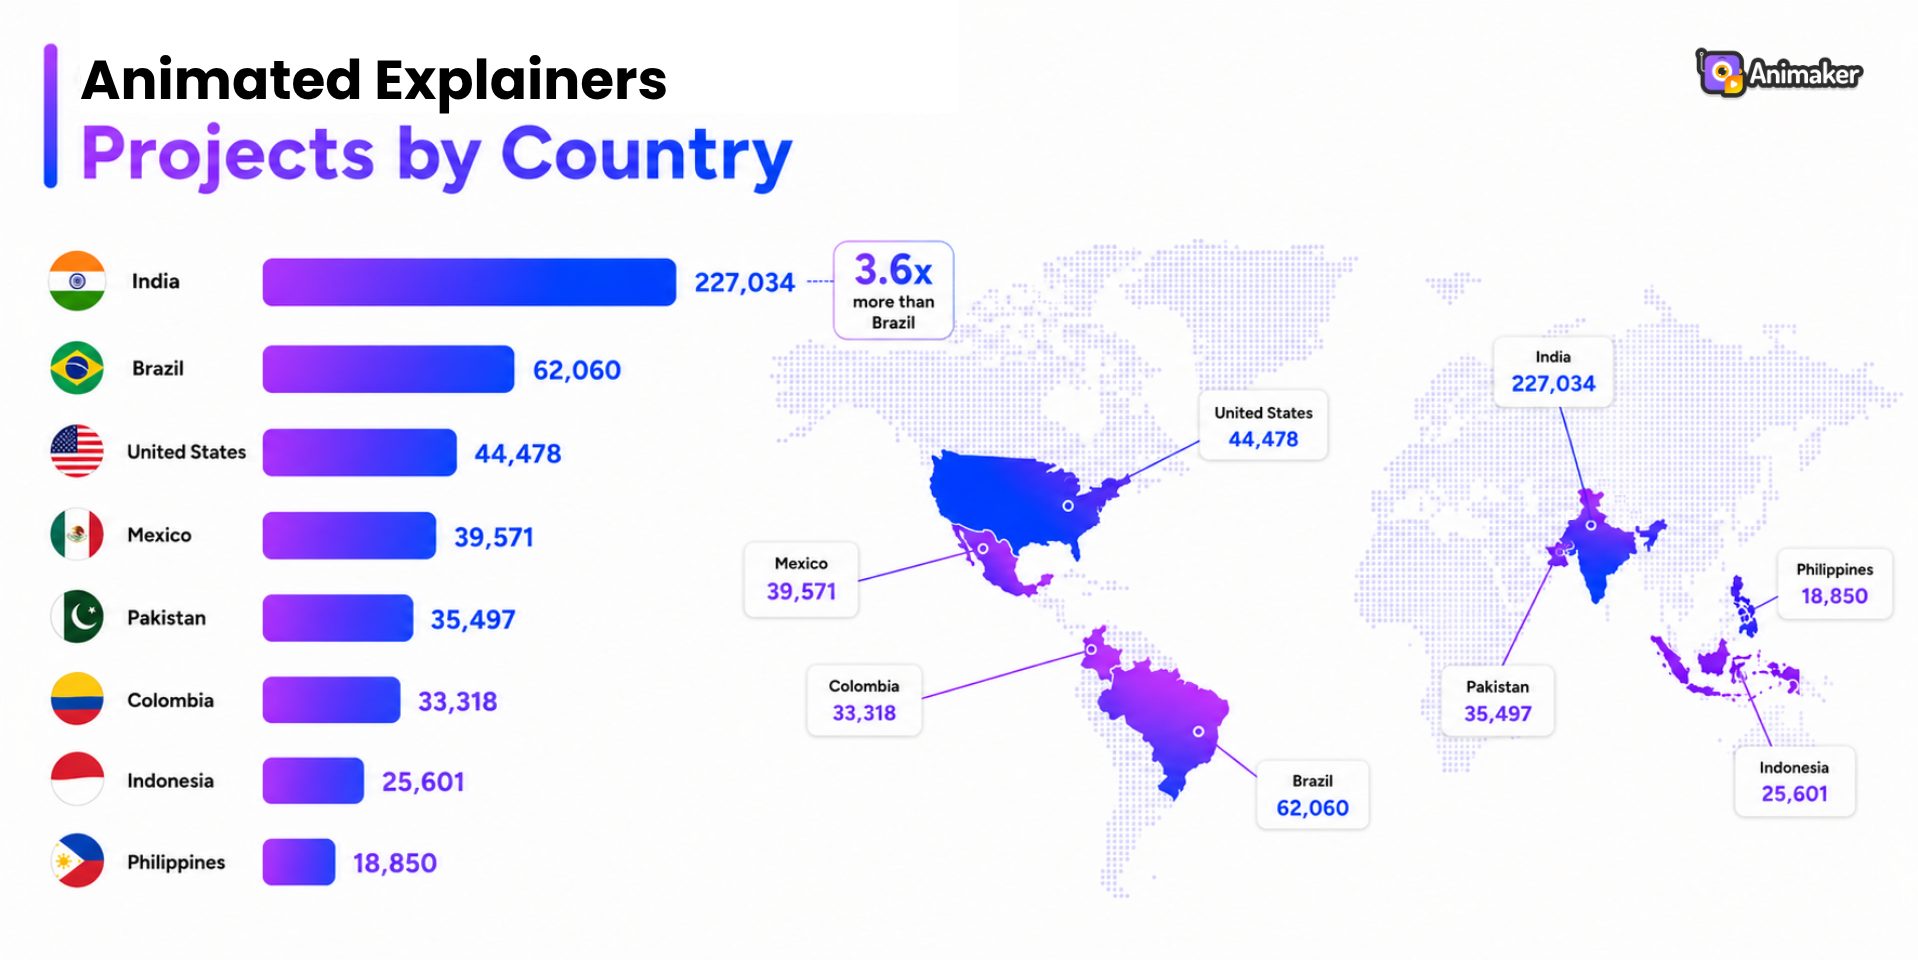
The U.S. (44,478), Mexico (39,571), and Pakistan (35,497) form a second tier, while Colombia (33,318), Indonesia (25,601), and the Philippines (18,850) represent emerging markets.
GenAI Animation
GenAI Animation adoption showed more widely distributed geographic patterns than the other two.
India leads with 154,035 projects, followed by Brazil (36,928), Pakistan (24,215), and the United States (24,010).
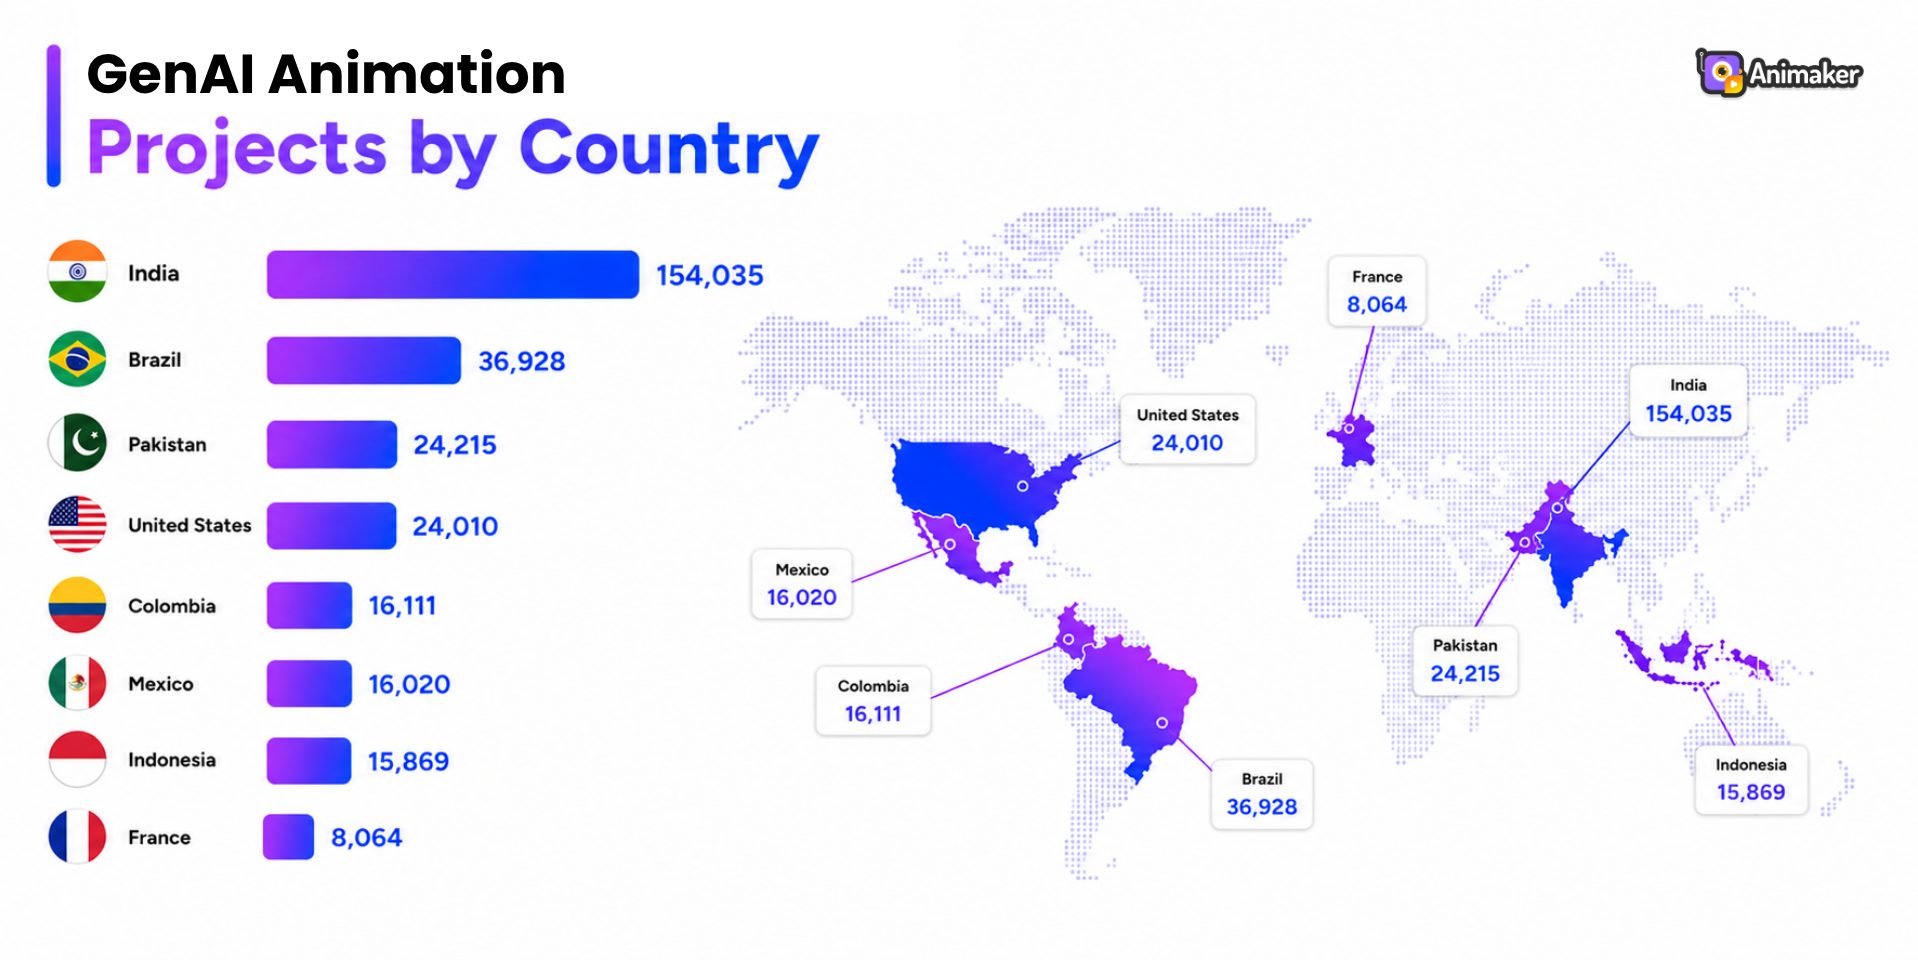 Colombia (16,111), Mexico (16,020), and Indonesia (15,869) show similar adoption levels, indicating AI's appeal across diverse markets.
France (8,064) appears in the GenAI top 10, suggesting European adoption is emerging primarily through AI-powered creation rather than template or explainer formats.
Animation Templates
India leads template adoption with 50,384 projects, followed by the United States with 19,383 projects and Mexico with 18,841 projects.
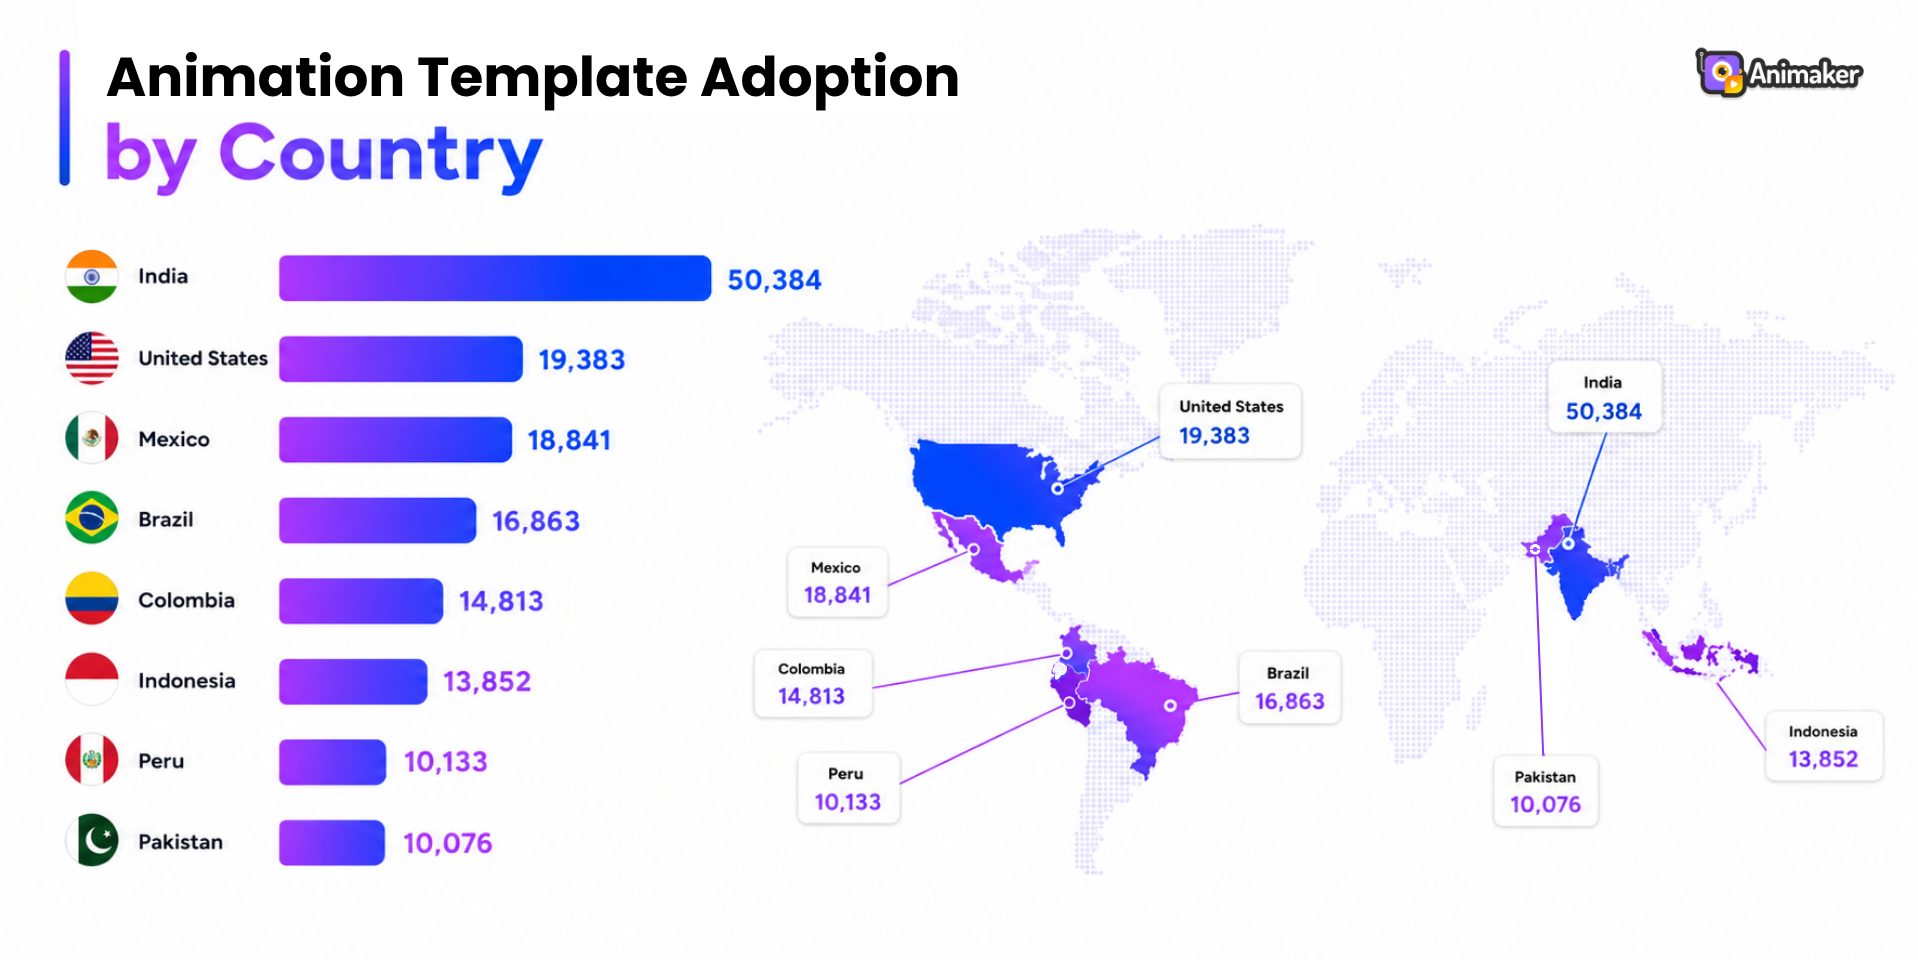 Latin American markets like Brazil (16,863 projects), Colombia (14,813 projects), and Peru (10,133 projects) show decent engagement.
Asian markets like Indonesia(13,852) and Pakistan(10,076) show global adoption patterns beyond Western markets.
This geographic diversity suggests that template-based creations solve quick-creation needs across emerging and developed markets.
Beyond geography, how does AI adoption vary across industries?
Industry-wise AI Adoption
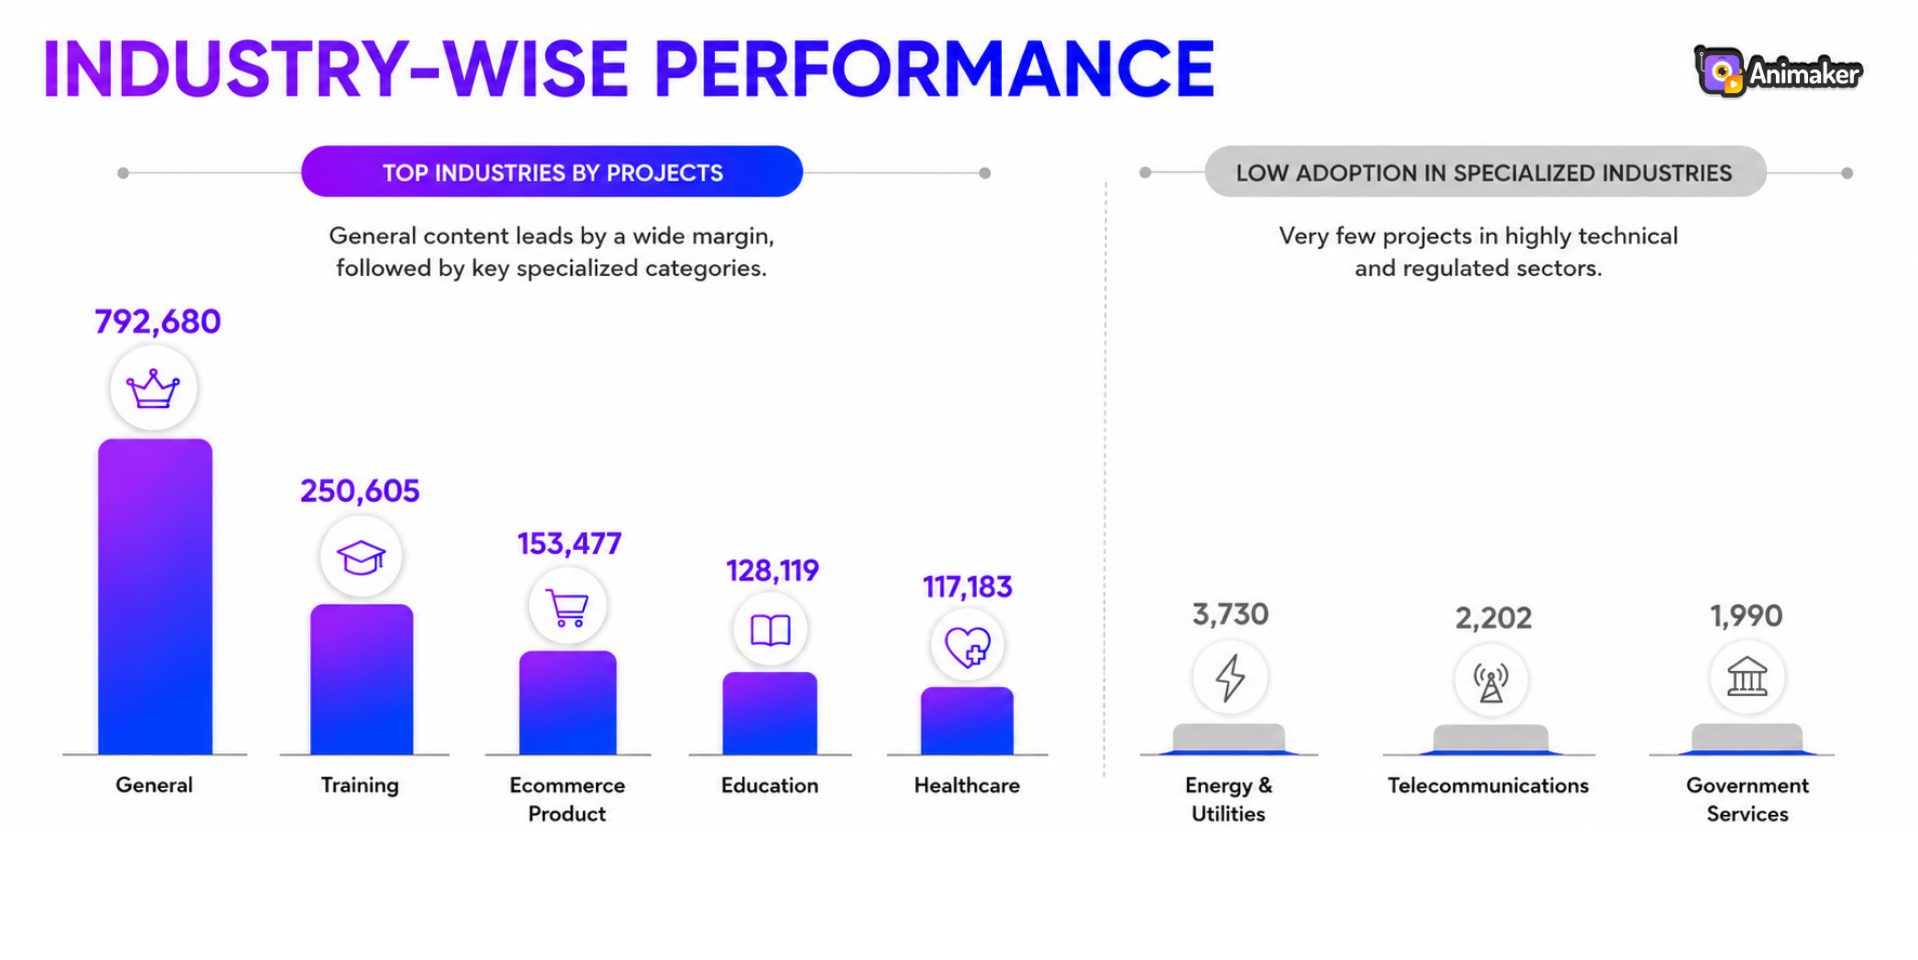
In percentage terms, General leads with 54.7% of all industry projects, followed by Specialized categories at 44.8% and Highly Specialized/Regulated sectors at 0.5%.
By industry, General content showed the strongest preference, with 792,680 projects.
Beyond this, Training (250,605) and Ecommerce Product (153,477) lead the specialized categories.
This large gap between General and the other two indicates that users are mainly creating uncategorized, multi-purpose animations rather than industry-specific content.
 At the same time, it points to an untapped opportunity in industry-specific animation, where solutions remain relatively underdeveloped.
This observation is backed up by more categories like Education (128,119) and Healthcare (117,183).
We also found very little adoption by highly specialized industries including Energy and Utilities (3730), Telecommunications (2202), and Government Services (1990).
This suggests that AI has not yet gained traction in highly technical, regulated sectors.
Beyond what users create, let’s look at preferred video durations.
Duration Patterns
In the case of Animated explainers, the most popular choice is 60 seconds, followed by 70, 50, 80, and 90 seconds.
This consistent usage across 50-100 seconds signals that users prefer creating explainer content with at least a minute or two of screen time.
The shortest would be just enough to cover quick overviews, and the longest (100 seconds) would be enough for a mini concept breakdown.
On the other hand, GenAI animations display extreme content diversity, with the top three preferred durations being 120 seconds (longest), 30 seconds (shortest), and 60 seconds (mid-range).
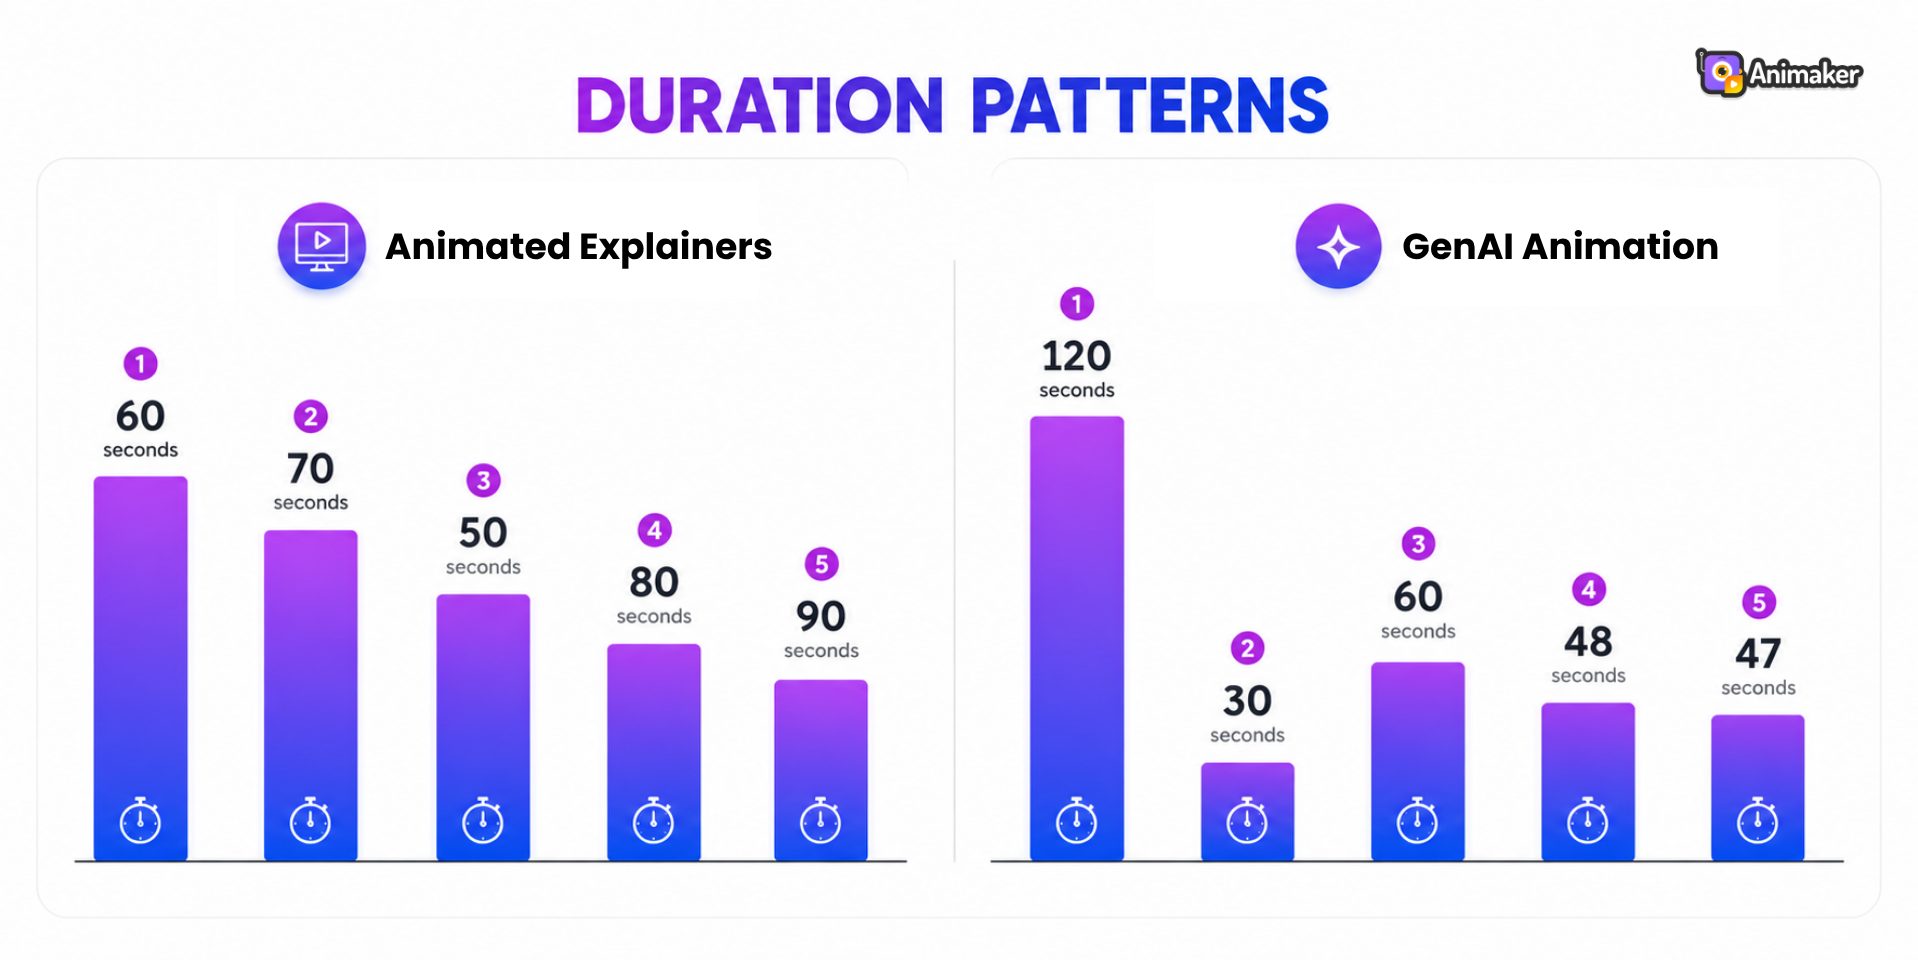 This spread-out preference suggests different use cases for AI-assisted creation. The long form is a nod to educational content, the shortest for short clips, and the mid-length is perfect for social media content.
What we can infer from this is that AI tools are now helping creators to produce omnichannel content easily instead of committing to a single content length strategy.
This is a flexibility that traditional template-assisted creation cannot match.
The State of Animation - Key Takeaways
The state of animation is standing at a point where AI adoption is changing creator workflows and platform expectations.
Traditional template-based creation is increasingly being replaced by AI-creation.
From our data analysis, we can safely say that AI-assisted creation is becoming the primary mode of creation rather than a secondary option.
This could mean experienced animators prefer AI for speeding up their workflows, and new users, probably beginners, go straight to AI-powered creation.
But the real insight is that the market is starting to split.
India and other emerging markets are bringing significant volume through AI, while the big gap between General and industry-specific categories reveals a major opportunity.
Specialized industries like healthcare, finance, and legal are heavily underserved.
This could suggest that these industries are yet to fully recognize the value of animation, or that existing tools simply don't meet their requirements for compliance, quality, and customization.
At the end of the day, animation software that helps creators produce 10 versions of content across 10 platforms in the time it takes competitors to render one video is going to stay in this competitive space.

![How to make 3D animation with Animaker? [Master 3D as a Beginner]](https://www.animaker.com/hub/wp-content/uploads/2026/09/Small.jpg)